

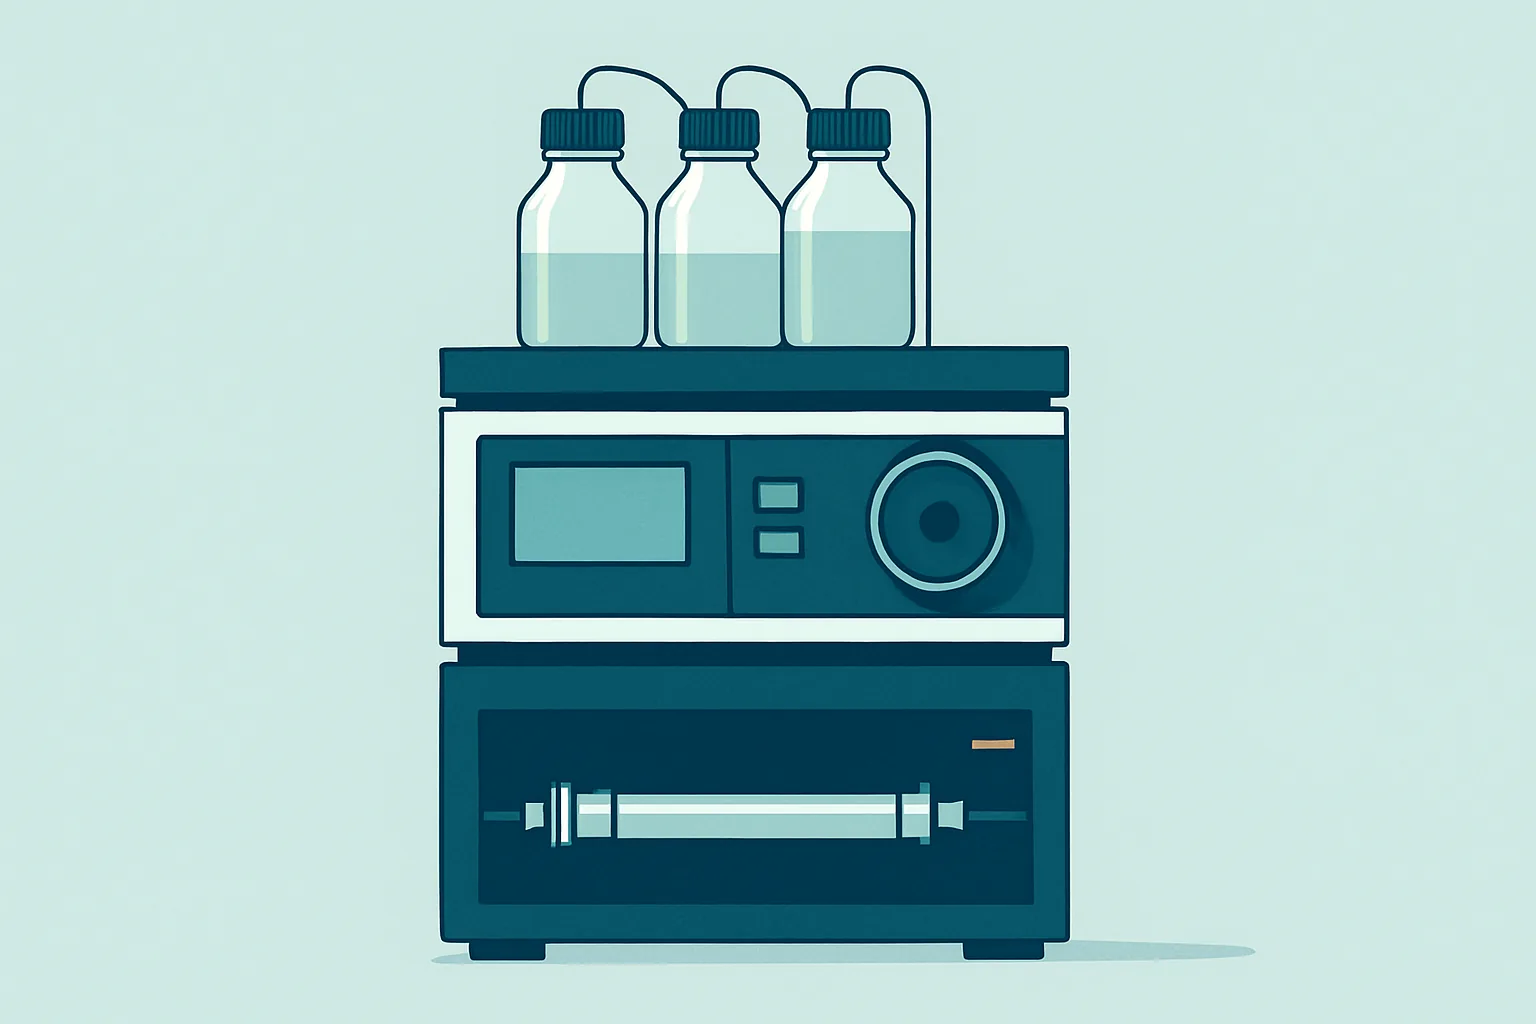
Testing reports mention HPLC constantly, usually in a methods line nobody reads. Behind that abbreviation sits a physical process that is easy to picture once and then hard to forget: a mixture is pushed through a tube packed with material that some of its components stick to more than others, and the ones that stick least come out first.
That is the entire principle. Everything that follows in a chromatography method, the choice of packing material, the solvent composition, the pressure, the temperature and the detector at the end, is engineering aimed at making the difference in stickiness large enough to be useful and the peaks narrow enough to be countable.
The reason chromatography matters so much in testing is that almost nothing else in the laboratory copes well with mixtures. A detector presented with fifty compounds at once reports a sum. A detector presented with fifty compounds arriving one at a time reports fifty answers. Separation in time is what converts a bulk measurement into a list of ingredients.
Key takeaways
- Separation happens because components spend different proportions of their journey stuck to the stationary phase rather than moving with the liquid.
- Retention time identifies a compound only when compared against a standard run on the same system under the same conditions.
- Reversed phase, where the column is oily and the solvent is watery, handles the large majority of routine analyses.
- Gradient elution shortens run times and sharpens late peaks, at the cost of needing a re-equilibration step between injections.
- Peak area relates to quantity only after calibration, because every detector responds differently to different compounds.
Stationary and Mobile Phases Explained
Every chromatographic separation involves two phases that do not mix. One stays put and one moves through it. The moving phase, the mobile phase, carries the sample. The stationary phase is what the sample interacts with along the way.
In high performance liquid chromatography, the stationary phase is a bed of tiny porous particles packed tightly into a steel tube, typically a few centimetres to a couple of dozen centimetres long and only a few millimetres across. The particles are usually silica, and their surface is chemically modified to give it the properties the method needs. Because the particles are small and the packing dense, forcing liquid through the bed at a useful speed takes substantial pressure, which is where the pump and the sturdy plumbing come from.
The mobile phase is the solvent mixture pumped through that bed. It is not a passive carrier. Its composition determines how strongly each analyte prefers to remain dissolved rather than adhere to the particle surface, so changing the solvent changes the separation as fundamentally as changing the column does.
Particle size is the quiet variable that drove the field forward. Smaller particles present more surface area and shorter diffusion distances, which produces narrower peaks and better separation in shorter columns. They also resist flow more strongly, requiring higher pressures. Systems built to tolerate those pressures are marketed under names emphasising ultra-high performance, but the underlying chemistry is unchanged; the improvement is mechanical.
Why Different Compounds Move at Different Speeds
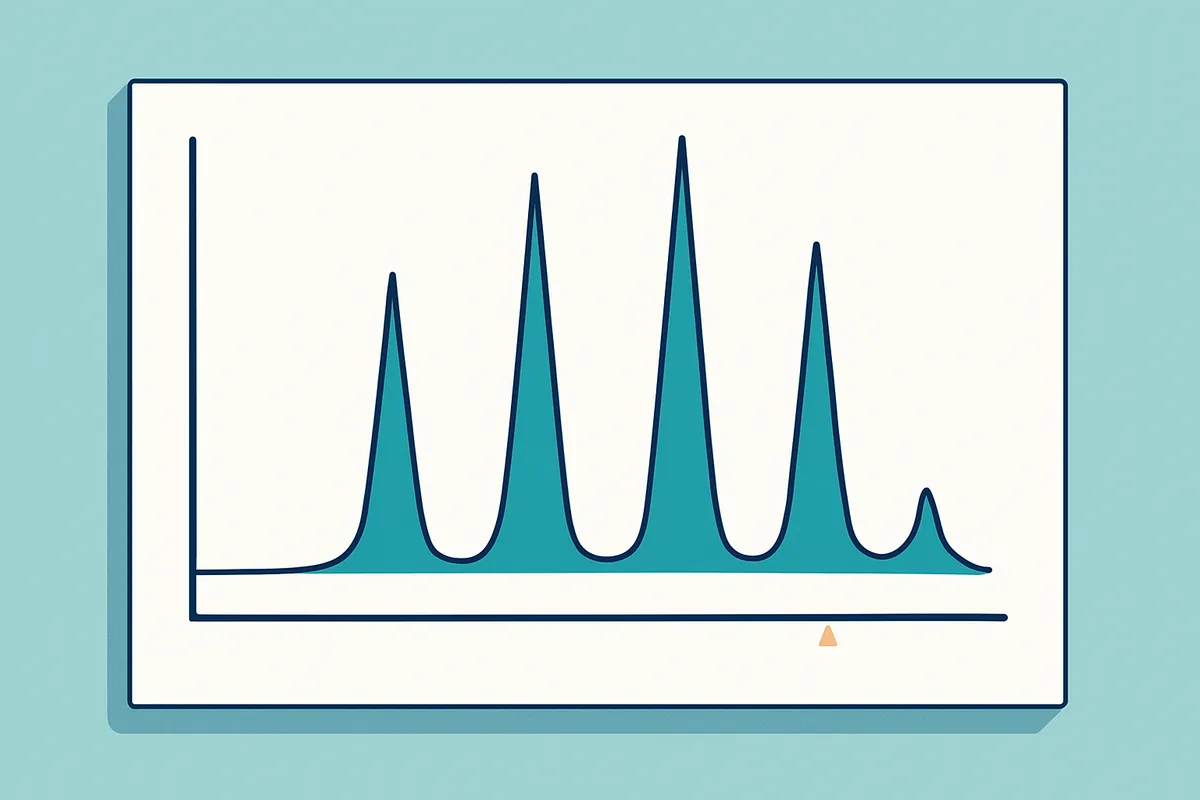
Picture a single molecule entering the column. It is swept along by the flowing solvent until it encounters the particle surface, where it may adhere briefly before releasing back into the stream. It repeats this thousands of times on its way down the column.
A molecule that adheres readily and releases slowly spends a large fraction of its journey stationary, and takes a long time to emerge. A molecule with little affinity for the surface spends almost all its time moving, and emerges quickly. Neither molecule travels faster than the solvent; the difference lies entirely in how much time each spends parked.
This is why chromatography separates rather than merely delays. Two compounds differing only slightly in their affinity accumulate that small difference over thousands of adsorption events, and the accumulated difference becomes a visible gap between peaks.
The same repeated exchange explains peak shape. Not every molecule of a given compound experiences exactly the same number of interactions, so a population injected as a sharp plug spreads into a roughly symmetrical band by the time it exits. Broadening is inevitable and increases with time on the column, which is why late-eluting peaks are wider and shorter than early ones even when they represent equal amounts.
Peak tailing, where a peak has a lazy trailing edge instead of a symmetrical shape, usually signals a second, stronger retention mechanism operating alongside the intended one. On modified silica the common culprit is exposed silanol groups on the underlying particle interacting with basic compounds. It is a chemistry problem misread as an instrument problem more often than the reverse.
Retention Time as an Identification Clue
The time between injection and the appearance of a peak is its retention time, and it is the primary identifying feature a chromatogram offers. It is also routinely over-interpreted.
Retention time is a property of the compound, the column, the mobile phase, the flow rate, the temperature and the instrument’s plumbing taken together. Change any one of them and the number changes. A retention time is therefore meaningful only relative to a standard of known identity analysed under identical conditions, ideally in the same batch of injections.
Even then, matching retention times is weak evidence on its own, because many compounds can share a retention time on a given column. Analysts strengthen the identification by running the sample on a second column with a different chemistry, by spiking the sample with the suspected standard and confirming that the peak grows rather than splits, or by placing a detector at the outlet that reports something structural rather than merely reporting arrival.
Retention times also drift within a sequence. Column temperature fluctuations, slow changes in mobile phase composition as volatile solvent evaporates from the reservoir, and gradual accumulation of strongly retained material at the column head all shift peaks. Laboratories manage this by bracketing sample injections with standards and by expressing retention relative to a reference peak rather than in absolute minutes.
Normal Phase Versus Reversed Phase
The two dominant modes of liquid chromatography differ in which phase is polar, and that single choice inverts the elution order.
Normal phase chromatography came first. The stationary phase is polar, typically bare silica, and the mobile phase is a non-polar organic solvent. Polar compounds stick to the polar surface and elute late; non-polar compounds pass through quickly.
Reversed phase inverts this. The silica surface is bonded with long hydrocarbon chains, making it effectively oily, and the mobile phase is mostly water mixed with an organic solvent such as methanol or acetonitrile. Now non-polar compounds prefer the oily surface and elute late, while polar compounds stay in the watery mobile phase and elute early.
| Feature | Normal phase | Reversed phase |
|---|---|---|
| Stationary phase | Polar, often bare silica | Non-polar bonded hydrocarbon chains |
| Mobile phase | Non-polar organic solvents | Water with methanol or acetonitrile |
| Elutes first | Non-polar compounds | Polar compounds |
| Typical use | Isomer separation, lipid classes | Most pharmaceutical and biological work |
| Compatibility with mass spectrometry | Poor to moderate | Good |
Reversed phase dominates modern practice for practical reasons rather than theoretical superiority. Most compounds of interest in pharmaceutical, clinical and food testing dissolve in water-organic mixtures. Those mixtures are cheap, less hazardous than the alternatives, and evaporate cleanly in a mass spectrometer interface. Normal phase retains a genuine niche where compounds are too similar in polarity for reversed phase to resolve them, particularly among isomers and lipid classes.
Additional modes exist for cases neither handles well. Ion exchange separates by charge and is standard for proteins and inorganic ions. Size exclusion separates by molecular size, using porous particles that small molecules enter and large ones bypass, which reverses the usual intuition by making large molecules elute first.
Gradient Elution and Peak Resolution
Running an entire analysis with a fixed mobile phase composition is called isocratic elution. It is simple and reproducible, and it has a chronic problem: a solvent strong enough to move the stickiest compound off the column in reasonable time will not retain the least sticky ones long enough to separate them from each other.
Gradient elution solves this by changing the mobile phase composition during the run, usually starting mostly aqueous in reversed phase and progressively increasing the organic proportion. Weakly retained compounds separate in the early, weak conditions. Strongly retained ones are held near the column head until the solvent becomes strong enough to release them, then travel through quickly and emerge as sharp peaks rather than broad smears.
The trade-off is time and reproducibility. After a gradient, the column must be flushed back to the starting composition and allowed to re-equilibrate before the next injection, and skimping on that step is a leading cause of drifting retention times across a sequence. Gradients also make baselines less flat, since the detector may respond to the changing solvent itself.
Resolution between two peaks depends on three things: how far apart their centres are, how narrow they are, and how much they are retained overall. Improving separation therefore has three levers. Change the chemistry to move peaks apart, improve the column efficiency to make peaks narrower, or increase retention so there is more room to work in. Analysts usually reach for the first, because chemistry changes produce large effects and the other two produce diminishing returns.
Detectors That Sit at the Column Outlet
Separation is invisible without something at the outlet to notice compounds emerging. The detector choice determines what the chromatogram can tell you and what it cannot.
Ultraviolet absorbance detectors are the workhorse. They shine light through the flowing stream and measure absorption at one or more wavelengths. They are stable, inexpensive and quantitative, but they only see compounds that absorb ultraviolet light, which excludes many sugars, lipids and simple aliphatic compounds. A diode array version records the full spectrum at every point, allowing an analyst to check whether the absorbance profile across a peak stays constant. A shifting profile means the peak contains more than one compound.
Fluorescence detectors are far more sensitive but apply only to compounds that fluoresce or can be chemically tagged to do so. Refractive index detectors respond to almost anything, which makes them useful for sugars and polymers, but they are insensitive and incompatible with gradients because the changing solvent swamps the signal. Charged aerosol and evaporative light scattering detectors evaporate the solvent and measure the residual particles, giving a response that depends less on the compound’s structure.
Mass spectrometry as a detector changes the character of the experiment, because it reports a mass rather than merely an arrival. Two compounds that overlap in time can still be distinguished if their masses differ. This is why coupled systems are the reference approach in contaminant and metabolite work.
Reading a Chromatogram for Purity
A chromatogram is a plot of detector response against time, and reading one well is largely a matter of knowing what to distrust.
Peak area, not height, is the quantitative measure, because area is less affected by peak broadening. But area converts to concentration only through calibration with known standards of the same compound, since detector response varies enormously between substances. A common shortcut, expressing purity as one peak’s area divided by the total area of all peaks, quietly assumes every impurity responds identically to the analyte. That assumption is rarely true and can flatter or exaggerate a purity figure.
The deeper limitation is that a chromatogram shows only what elutes and only what the detector sees. A compound retained so strongly that it never emerges within the run, or one that passes straight through with the solvent front, or one invisible to the detector, contributes nothing to the trace. A clean-looking chromatogram is evidence of the absence of detectable, eluting impurities, which is a narrower claim than purity.
Signs worth attention include shoulders on a peak, which suggest a partially separated co-eluting compound; peaks whose spectral profile changes across their width; baseline drift that makes integration boundaries arbitrary; and peaks appearing at the very start of the run, where anything unretained arrives together and cannot be distinguished.
The practical habit is to treat a chromatogram as an argument rather than a photograph. It asserts that the sample contained certain things in certain amounts, on the basis of a method chosen to make those things visible. Asking what the method was designed to find, and what it would have missed, extracts far more from the page than reading the peaks alone.
Frequently asked questions
Does a single peak mean the sample is pure?
It means the method found one detectable, eluting component under those specific conditions. Impurities that do not absorb at the monitored wavelength, that stick permanently to the column, or that co-elute exactly with the main compound all remain invisible. Laboratories address this by running orthogonal methods, meaning a second separation with a genuinely different retention mechanism, and by using a detector that reports structural information. A single peak on one method is reassuring; a single peak on two dissimilar methods with a mass-selective detector is considerably stronger evidence.
Why do retention times shift between laboratories using the same method?
Because a method specifies conditions, not outcomes, and small differences accumulate. Column packing varies between manufacturing batches even within one product line. Instrument plumbing differs in internal volume, which changes how long the gradient takes to reach the column. Ambient temperature affects the column unless it is thermostatted. Solvent lots differ slightly in composition. Well-written methods therefore identify peaks by relative retention against a reference compound rather than absolute time, which cancels most of this drift.
What causes a column to stop working?
Most often the accumulation of strongly retained sample components at the inlet, which changes the local chemistry and distorts peak shape. Particulates from unfiltered samples block the frit at the column head and raise back pressure. Operating outside the specified pH range slowly strips the bonded phase from the silica or dissolves the silica itself, which lowers retention permanently. Guard columns, sample filtration and washing steps between sequences extend column life considerably, and rising back pressure is usually the first warning sign.
Is HPLC the same thing as LC-MS?
LC-MS is HPLC with a mass spectrometer as the detector instead of, or in addition to, an optical one. The separation chemistry is identical, though methods are adapted so the mobile phase evaporates cleanly and contains no non-volatile additives that would foul the ion source. The combination gives two independent identifying features, retention time and mass, which is why it has become the default for trace analysis. Standalone HPLC with an ultraviolet detector remains entirely adequate for assays of a known compound at reasonable concentrations.
Why does a method specify the column temperature so precisely?
Temperature affects both the affinity of compounds for the stationary phase and the viscosity of the mobile phase, so it shifts retention times and back pressure together. Higher temperatures generally shorten retention and sharpen peaks by speeding up the exchange between phases, but they also accelerate column degradation and can decompose thermally fragile analytes. Because the effect is compound-specific, two peaks can move by different amounts and their separation can improve or collapse. Controlling temperature is therefore a requirement for reproducibility, not a refinement.
The reason chromatography has survived the arrival of far more glamorous instrumentation is that it addresses a problem nothing else solves cheaply. Detectors have become extraordinarily sensitive, but sensitivity without selectivity produces a large number confidently attached to the wrong thing. Spreading a mixture out in time gives every subsequent measurement a fighting chance.
For anyone reading a testing report, the useful questions are which separation mode was used, what the detector could see, and whether identification rested on retention time alone or on something structural as well. Those three answers usually determine how much the numbers underneath are worth.