
The complete blood count is the most frequently ordered test in medicine, and it is also the one patients are most often handed with no explanation beyond a row of asterisks marking the values that fell outside the printed range. It looks like a single test. It is not. A CBC is three largely independent examinations that happen to run on the same tube of blood and print on the same page.
Understanding it becomes far easier once you stop reading it top to bottom and start reading it in those three groups. Red cells carry oxygen. White cells respond to threats. Platelets stop bleeding. Each group has a headline count and a set of supporting measurements, and in almost every case the supporting measurements are where the useful information lives.
This piece walks the report the way the analyser produces it, which is not the order it prints in.
Key takeaways
- A CBC is three separate examinations printed together: red cells, white cells, and platelets.
- The red cell indices, particularly MCV and RDW, usually say more than the haemoglobin value alone.
- Modern analysers count tens of thousands of cells in seconds, but they classify by physical properties, not by looking.
- A flagged result frequently triggers a manual smear review, where a human overrules the machine.
- Several common abnormalities are artefacts of the sample rather than the patient.
The Three Cell Lines a CBC Counts
Blood contains three functional populations of cells suspended in plasma, and they are produced by the same bone marrow through different maturation pathways. Because they share an origin, a problem in the marrow itself tends to disturb all three at once. That pattern, where every line falls together, is one of the more clinically significant things a CBC can show, and it is invisible if you read each number in isolation.
Red cells are by far the most numerous, outnumbering white cells by roughly a thousand to one. Their job is gas transport, and essentially everything measured about them is a proxy for how well that job can be done. White cells are a heterogeneous collection of at least five distinct cell types with different lifespans and different triggers. Grouping them into a single count discards most of what they can tell you, which is why the differential exists. Platelets are not really cells at all but fragments shed from much larger marrow cells, and their small size creates specific counting problems that recur throughout this piece.
The tube itself matters. A CBC is collected into a tube containing EDTA, an anticoagulant that binds calcium and prevents clotting by starving the coagulation cascade of a required cofactor. This preserves cell morphology reasonably well for several hours. It also, in a small number of people, causes platelets to clump together in the tube in a way they never would in the body, which produces one of the most common false results in laboratory medicine.
How a Haematology Analyser Sorts Cells
The instrument does not look at cells. This is the single most useful thing to understand about the CBC, because nearly every quirk of the report follows from it.
Most analysers combine two or three physical measurement principles. The oldest is impedance counting, where cells are drawn in single file through a narrow aperture with an electrical current across it. Cells are poor conductors, so each one passing through causes a brief spike in electrical resistance. The number of spikes gives the count, and the size of each spike is proportional to the cell’s volume. This is elegant and fast, and it explains why volume, not identity, is the analyser’s native language.
Light scatter adds a second dimension. A laser illuminates each cell as it passes, and detectors measure how light scatters forwards and sideways. Forward scatter correlates broadly with size, while side scatter reflects internal complexity, meaning granularity and nuclear shape. A neutrophil packed with granules scatters light sideways very differently from a smooth lymphocyte. Plotting every cell on these two axes produces clusters, and the analyser assigns identity by which cluster a cell falls into.
Some instruments add fluorescent staining of nucleic acid, which separates cells that still contain RNA from those that do not. This is how reticulocytes, the immature red cells released when the marrow is working hard, are distinguished from mature ones.
The consequence of all this is that the analyser classifies by physical properties and assumes those properties map cleanly onto cell identity. When a cell is abnormal in a way that shifts it out of its expected cluster, the machine either misclassifies it or flags the sample as uninterpretable. Both outcomes are informative, and the flag is often more clinically important than any number on the report.
Reading Haemoglobin, Haematocrit and Red Cell Indices
Haemoglobin is the value most people look at first, and it is the most directly meaningful: it measures the concentration of oxygen-carrying protein in the blood, determined chemically by lysing the red cells and measuring absorbance. It is a genuine measurement rather than a derived one.
Haematocrit is the proportion of blood volume occupied by red cells. On modern analysers it is usually calculated from the red cell count and the mean cell volume rather than measured by spinning a tube, which is why it tracks haemoglobin so closely. As a rough rule, haematocrit runs around three times the haemoglobin value. When those two drift apart, it usually points to something about cell size or hydration rather than a change in oxygen-carrying capacity.
The indices are where the interpretation actually happens.
| Index | What it describes | Typical direction in iron deficiency | Typical direction in B12 or folate deficiency |
|---|---|---|---|
| MCV | Average red cell volume | Low | High |
| MCH | Average haemoglobin per cell | Low | High or normal |
| MCHC | Haemoglobin concentration within cells | Low or normal | Normal |
| RDW | Variation in cell size | High | High |
| Reticulocytes | New cells released by marrow | Low relative to anaemia | Low relative to anaemia |
Mean cell volume is the workhorse. Anaemias are traditionally sorted into microcytic, normocytic and macrocytic by MCV alone, and that single split narrows the differential enormously before any other test is ordered. Small cells point toward iron deficiency or thalassaemia. Large cells point toward B12 or folate deficiency, alcohol, certain medications, or marrow disorders. Normal-sized cells with a low haemoglobin point toward blood loss, chronic disease, or a marrow that is not producing enough.
Importantly, MCV is an average, and averages hide bimodal distributions. Someone with both iron deficiency and B12 deficiency can present with a perfectly normal MCV because the small cells and the large cells cancel out. This is exactly the situation the next value was designed to catch.
What RDW Adds That Haemoglobin Misses
Red cell distribution width measures how much cell size varies within the sample. It is a coefficient of variation drawn from the same volume data the analyser already collects, which makes it free, and it is chronically underused.
A healthy marrow produces red cells of remarkably consistent size. When production is disturbed, that consistency degrades before the average shifts far enough to leave the reference range. In early iron deficiency, the marrow begins producing small cells while the existing normal-sized population, with a lifespan of about four months, is still circulating. The MCV, being an average dominated by the existing population, stays normal. The RDW rises because the sample now contains two populations.
This makes RDW an early signal and a useful discriminator. In the classic comparison, iron deficiency and thalassaemia trait both produce small cells, but thalassaemia trait produces uniformly small cells because it is a stable inherited condition rather than a developing deficiency. Iron deficiency raises RDW; thalassaemia trait usually does not. That distinction spares a great many people an unnecessary course of iron.
RDW also rises after treatment begins, which surprises people. When iron is replaced, the marrow starts producing normal-sized cells alongside the existing small ones, and the population becomes more mixed before it becomes more uniform. A rising RDW several weeks into treatment is often a sign that treatment is working.
White Cell Differentials and What Shifts Them
The total white cell count is close to useless on its own, because a rise in one cell type can mask a fall in another. The differential breaks the total into its components, and each component responds to different things.
Neutrophils dominate in adults and respond within hours to bacterial infection, tissue injury, physical stress, and corticosteroids. Their short circulating lifespan, measured in hours, is what makes them such a fast-moving indicator. A substantial proportion of neutrophils are not circulating freely at any moment but are loosely attached to blood vessel walls, and adrenaline or exercise can release that marginated pool into circulation within minutes. This produces a genuinely raised neutrophil count that reflects nothing more than the patient having run for the bus.
Lymphocytes respond to viral infection and, in specific patterns, to chronic conditions. They are the dominant white cell in young children, which means paediatric reference ranges differ substantially from adult ones and applying the wrong range generates false alarms. Eosinophils rise with parasitic infection, allergic conditions and certain drug reactions. Monocytes rise in chronic inflammation and recovering infection. Basophils are rare enough that small absolute changes look dramatic in percentage terms.
That percentage point matters more than it seems. A differential reported as percentages can mislead badly when the total count is abnormal. A lymphocyte percentage of 60 sounds high, but if the total white count is low because neutrophils have collapsed, the absolute lymphocyte count may be entirely normal. Always work with absolute counts where the report provides them.
Platelet Counts, Clumping and False Lows
Platelets are small, and their size overlaps with the debris that circulates in any blood sample. Analysers count them mostly by volume, which means anything else of similar size can be miscounted as a platelet, and platelets that stick together can be counted as one larger object or ignored entirely.
EDTA-dependent pseudothrombocytopenia is the classic artefact. In a minority of people, antibodies present in the blood cause platelets to clump specifically in the presence of the EDTA anticoagulant. The clumps are too large to be counted as platelets, so the reported count falls, sometimes dramatically. The patient’s actual platelet count is normal, and they have no bleeding tendency whatsoever. The give-away is a microscope review showing visible clumps, and the confirmation is a repeat sample drawn into citrate instead of EDTA.
This is not a rare curiosity. It is a routine finding that laboratories check for whenever a low platelet count appears without clinical explanation, and it is a good example of why an isolated abnormal number should not drive a decision by itself.
Mean platelet volume, when reported, adds context. Larger platelets are generally younger, so a low count with large platelets suggests the marrow is producing and something is destroying them peripherally. A low count with small platelets points more toward a production problem.
When a Smear Review Overrules the Machine
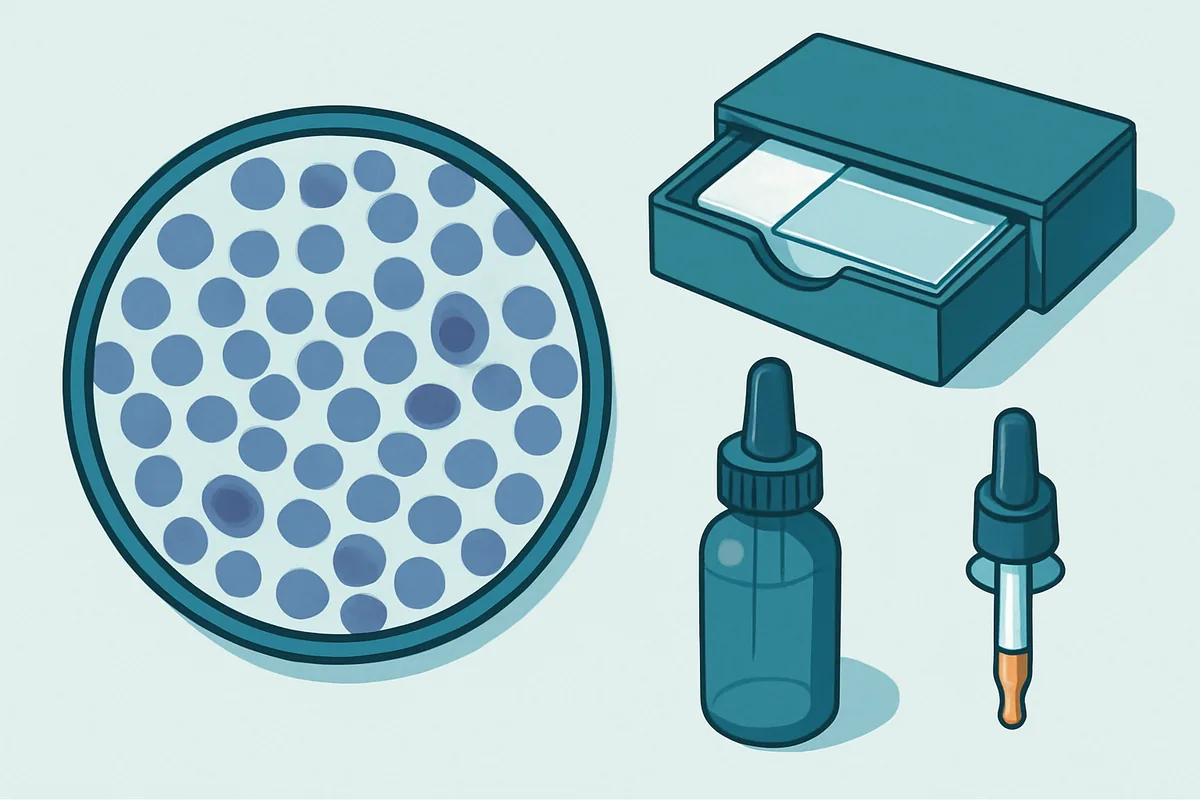
Every laboratory sets rules that trigger a manual examination of the blood film. A human places a drop of blood on a slide, spreads it, stains it, and looks at it through a microscope. This is slower and more expensive than the analyser by a wide margin, and it remains indispensable.
The triggers are typically an analyser flag, a count outside defined limits, or a significant change from the patient’s previous result. What the reviewer can see that the machine cannot includes the actual shape of red cells, the presence of immature white cells that the analyser would misclassify, inclusions within cells, and whether apparently low platelets are simply clumped.
Cell shape carries diagnostic information no volume measurement captures. Sickled cells, fragmented cells suggesting mechanical destruction, spherical cells lacking their central pallor, and cells containing malaria parasites are all identified visually. In each case the analyser produces numbers that are unremarkable or mildly odd, and the diagnosis comes from the slide.
The practical consequence for anyone reading their own result is that a report which mentions a smear review has already had human judgement applied to it. That comment field is usually the most information-dense part of the page.
Frequently asked questions
Does one abnormal value on a CBC mean something is wrong?
Not usually. Reference ranges are set to include the middle 95 percent of a healthy reference population, which means roughly one healthy person in twenty falls outside the range on any given measurement. With around fifteen values on a typical CBC, a completely healthy person has a substantial chance of at least one flagged result. Patterns across related values matter far more than any single flag.
Why did my haemoglobin change between two tests when nothing else did?
Hydration state shifts haemoglobin concentration without changing the total amount of haemoglobin in the body. Being dehydrated concentrates the blood and raises the value; a large volume of intravenous fluid dilutes it. Posture matters too, as lying down for a prolonged period shifts fluid into the circulation. Changes of a few percent between samples are frequently explained by these factors alone.
What does it mean if the lab could not process my sample?
The most common reasons are clotting in the tube, an insufficient volume for the required blood-to-anticoagulant ratio, or haemolysis, meaning red cells have ruptured. All three are collection or transport problems rather than findings about you. Redrawing is the only remedy, since the analyser cannot correct for them.
Should I be worried about a slightly raised white cell count?
On its own, rarely. Recent exercise, acute stress, smoking, pregnancy and a great many ordinary infections all raise it temporarily. The clinically important questions are which cell type rose, whether immature forms appeared, and whether the change persists on a repeat sample. An isolated mild elevation with no symptoms is usually followed rather than investigated aggressively.
How often is a CBC worth repeating?
That depends entirely on why it was done. For a stable finding under monitoring, intervals of months are typical. For an acute illness, daily testing may be appropriate. Repeating a mildly abnormal result immediately often adds nothing, because short-term biological variation and analytical imprecision together can account for small differences between two samples drawn hours apart.
The habit worth building is reading the CBC as three grouped stories rather than a list. Ask what the red cell indices say about production and size distribution. Ask which white cell population moved and whether the absolute count actually changed. Ask whether a low platelet count has been confirmed on a film. Those three questions extract most of the information the test contains, and they will steer you away from the single flagged number that so often turns out to mean nothing at all.
This is education, not medical advice. Laboratory results only carry meaning alongside your symptoms, history and examination. Talk to a qualified clinician about your own results before changing anything about your care or supplements.